
Ask your data

2 free questions

ASK YOUR DATA

Upload spreadsheet, ask a question, get an answer.
analysisresults

Upload CSV or Google Sheet here

Survey exports, sales sheets, invoice lists. For a Google Sheet, use File → Download → CSV first. No file? Try the sample.

Your upload remains on your computer and when you ask a question, only a short summary and the numbers needed for the answer are used.

supplier_spend_Q3.xlsx
fx
VendorRegionBilledContractVariance
2NorthlineWest48,20046,000+2,200
3BramwellEast31,90024,500+7,400
4Kestrel CoWest12,05012,000+50
5OakmereSouth66,40052,100+14,300
6FenwickNorth9,8009,900−100
7HaldenEast27,30027,000+300
8CorranSouth44,70029,600+15,100
9Ellis & CoWest18,15018,000+150
10MarlowNorth22,40022,250+150
11TessalyEast15,90015,700+200

saved this quarter

$0
Amy, working through the sheet
Amy
3 suppliers overbilled · $36,800 recovered

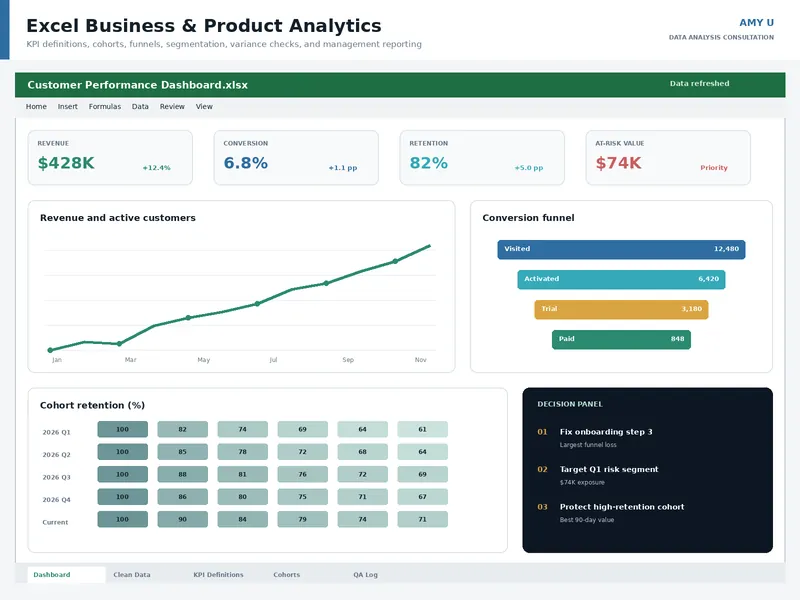
Manage your spreadsheets and workflows, survey analysis, quantitative and qualitative analysis and consultancy.

Recent work

Receivables ageing model

Build ageing buckets from invoice ledger and rank the collection by worklist rather than age.

This is synthetic data, my clients can run their data on it.

  1. How much cash is outstanding?And how much of it is already overdue.
  2. How long does it take to get paid?Days sales outstanding, month by month.
  3. Who is driving the overdue balance?Top debtors and segments, ranked by exposure.
  4. Is collection getting better?Change the as-of date and the whole book re-ages.
ExcelPower Query6 sheets7,043 formulasNo macros
Open receivables by age $000s

430 invoices, 41 still open. Darker is older. Total open $417K.

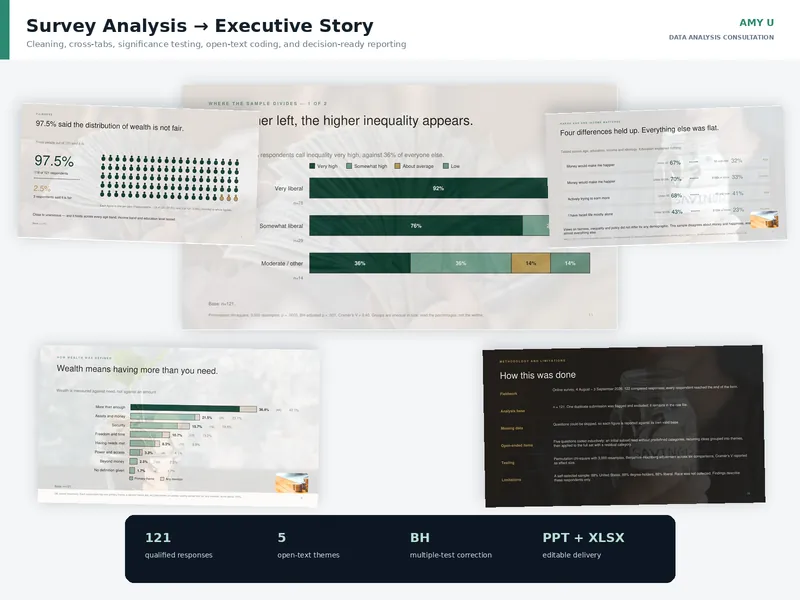
Survey analysis for a book on wealth and inequality

Author · September 2026

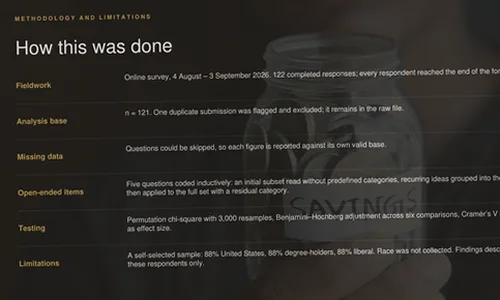
  1. The problemA writer had run a 122-response survey on wealth, fairness and inequality for a book proposal and needed to know what participants thought about wealth. The survey platform’s automatic charts counted every question against all 122 submissions, including the ones people had skipped, and a duplicate entry. Five of the seventeen questions were open-ended free text that no automated summary could handle.
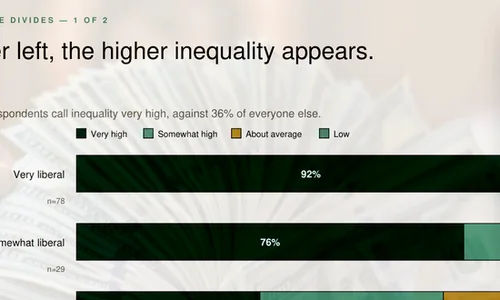
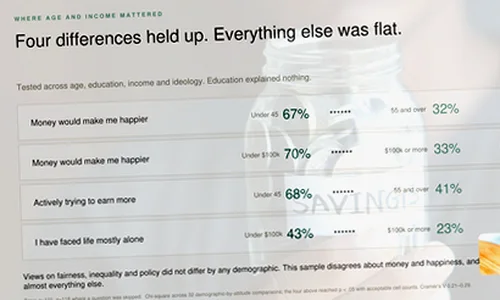
  2. What I didI rebuilt the dataset, set a valid base for each question, and coded 511 free-text responses into themes. Attitudes were then compared across age, education, income and political ideology, separating differences that held up under testing from those that were only patterns in the sample.
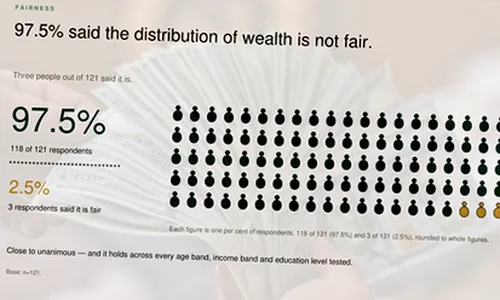
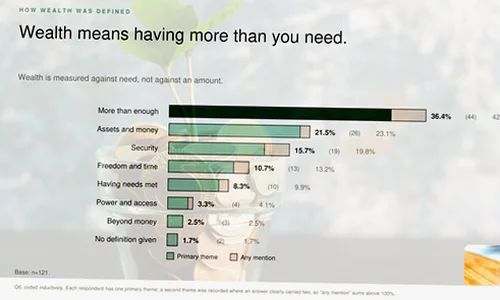
  3. What we foundRespondents described wealth as a condition rather than an amount: one person in 121 named an actual figure. Of the 95 asked to name three admirable figures from history, nine named anyone wealthy, a pattern the author had suspected and could now state with a number.
Deck cover: What does wealth mean to you?

“This is excellent. Very happy with this work.”

Client, on delivery

Deliverables: analytical report · publisher-ready findings summary · twelve-slide presentation

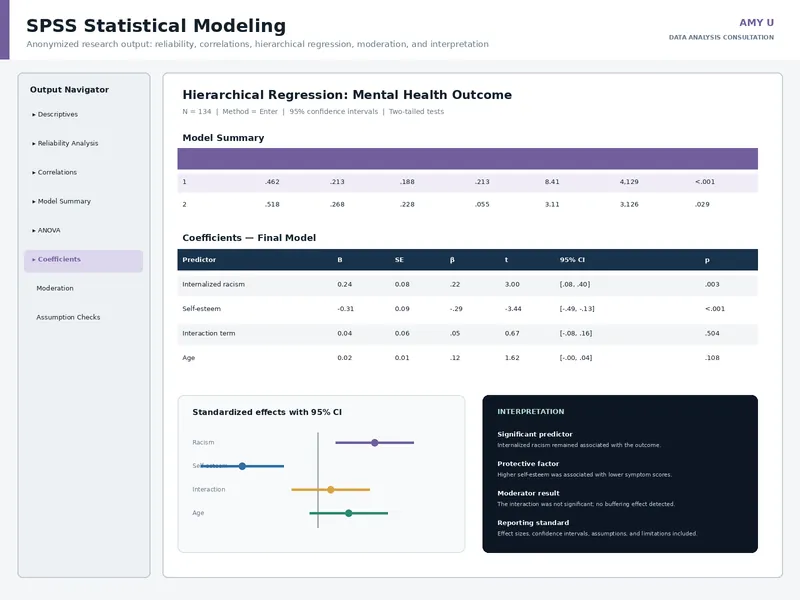
Internalised racism study

Scale reliability, correlation structure, then hierarchical regression for a PhD thesis.

Demographic variablesage · gender · income Depressive Internalized racism Anxiety Internalized racism Depressive symptoms Anxiety symptoms Self-esteemmoderator Depressive symptoms Anxiety symptoms
Study model · dashed lines show the moderator.

“Amy is diligent, timely, and a great communicator. She was easy to work with, agile in her thinking, and committed to providing what was needed for a research- and data-driven academic project. I would definitely hire her again.”

Cronbach’s α · hierarchical regression · SPSS.

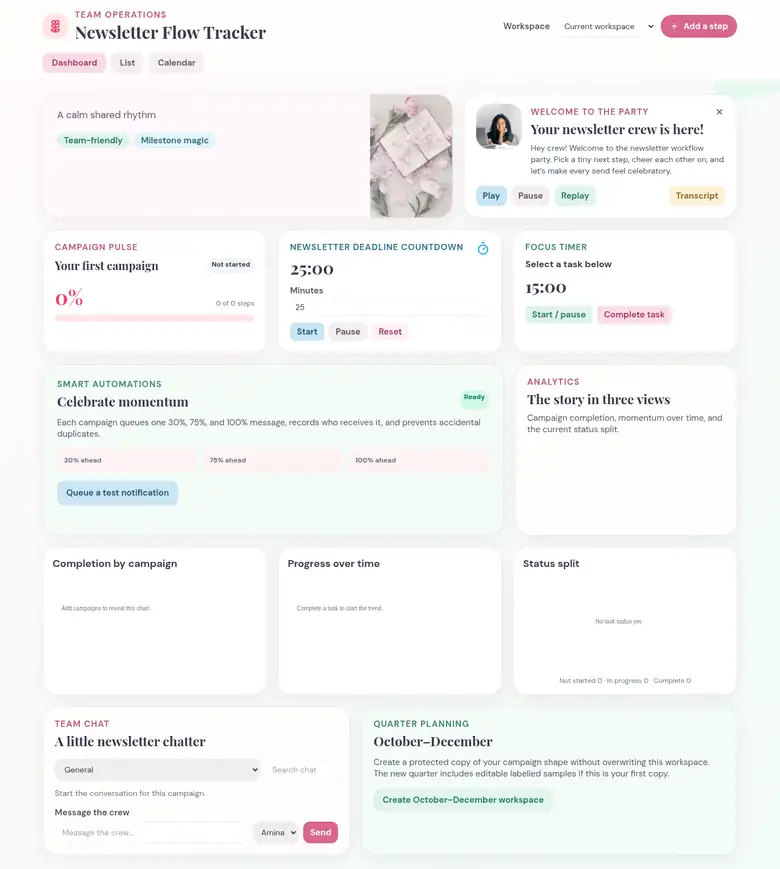
Newsletter Flow Tracker

End to end shared workspace for campaign process and progress, a deadline countdown, and multiple work views.

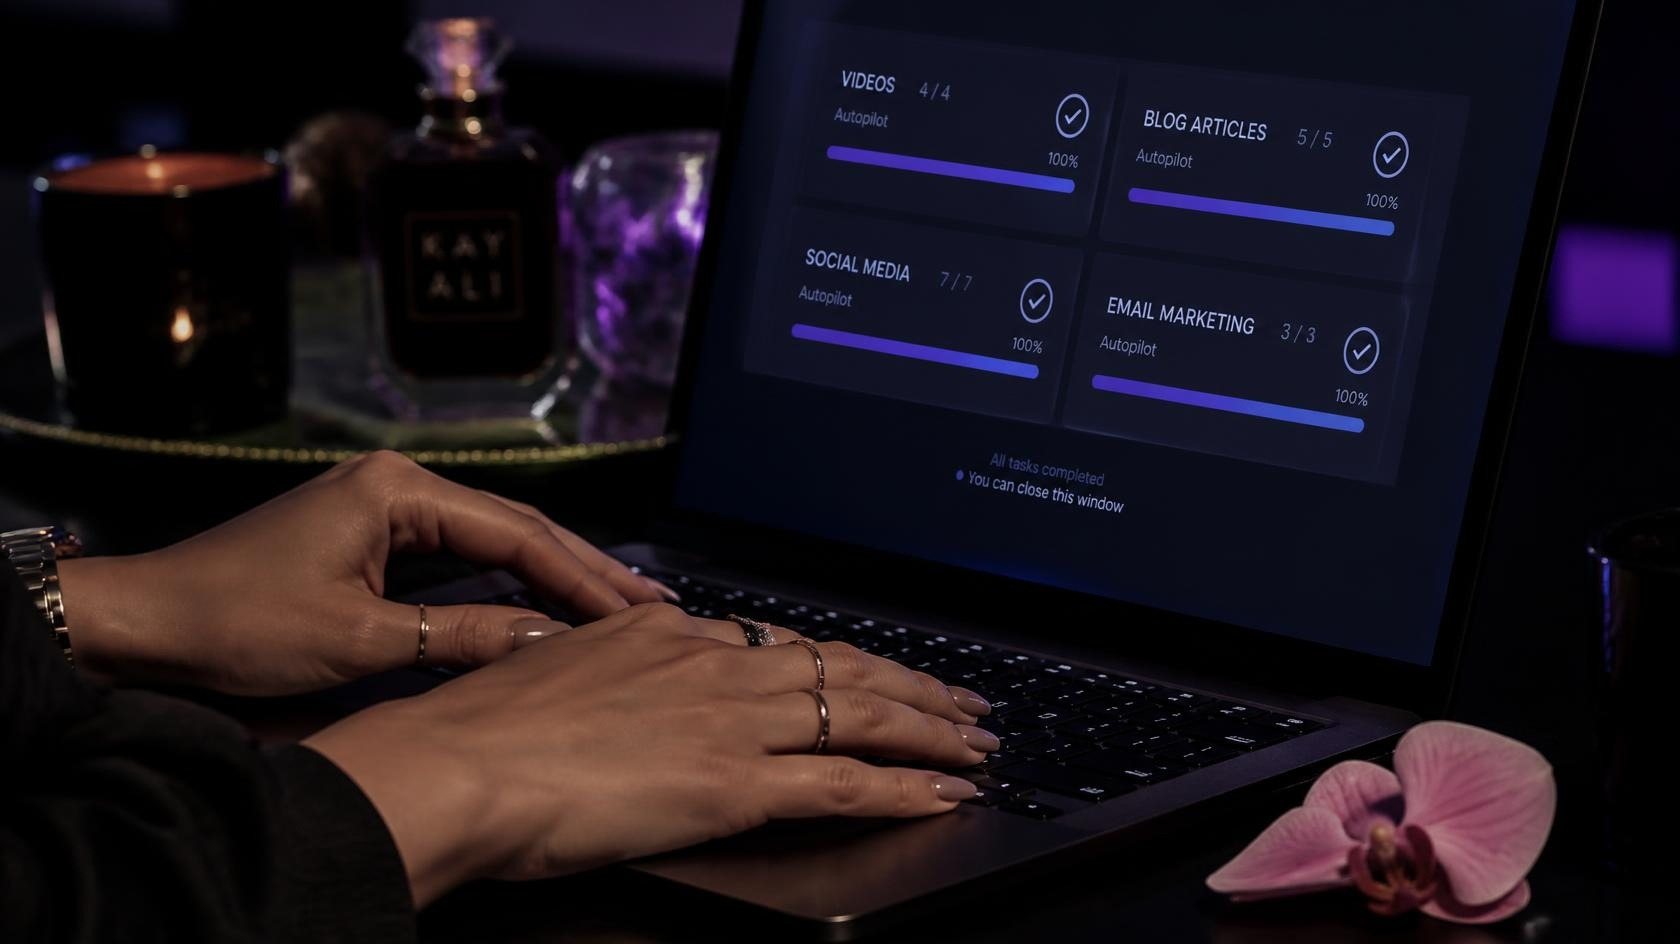
Hands typing at a laptop with campaign tasks on screen
Product designCanvaTeam workspace
Newsletter Flow Tracker dashboard
Designed and built end to end.

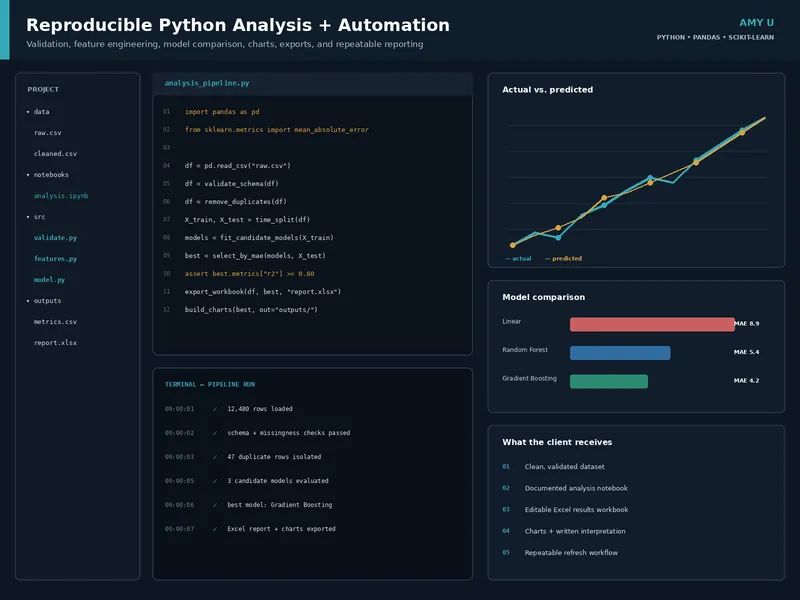
Scheduled reporting pipeline

Built for SMBs. Pulls from source systems on a schedule, cleans and reconciles in Python, drops a fresh workbook in the team’s shared drive.

Pythonn8nScheduledShared drive
Automated weekly report for shared drive.

Health program survey

Instrument review, sampling and weighting, analysis and final report for program teams and non-technical stakeholders.

  1. Instrument reviewQuestions checked for wording, order and skip logic before fieldwork.
  2. Sampling and weightingResponses weighted back to the program population.
  3. AnalysisCross-tabs and tests on what changed and for whom.
  4. Final reportWritten for program teams and non-technical stakeholders.
SPSSWeightingBoard report
A finished asset from the health program survey

Grant & funding agent

Case study. A funding search that used to mean an afternoon of open tabs, done in one run.

  1. The problemFinding money means reading page after page of eligibility rules, and most of them rule you out. The few that fit get missed or found after the deadline.
  2. What it doesReads the applicant’s profile, checks it against 20 real grants and fellowships, sorts each into Apply now, Next round, Check first or Not a fit, and drafts the opening of the best application.
  3. ResultsAll 20 ruled on in about a minute. Every verdict names the rule that decided it, and the draft leaves blanks for facts only the applicant can fill in.
  4. ImpactA shortlist and a first draft in one sitting. Nothing is submitted without the applicant’s OK.
AgentTool callsEligibility rulesDraft for approval
Funding20 checked
Reporting grant · up to $10kApply now
Health journalism fellowshipNext round
Writers’ residency · $1kApply now
Poetry scholarshipNot a fit
Run on an example profile. Funder details checked October 12, 2026. Live demo on request.

Survey sorter

Case study. An agent that sorts open-ended survey answers, then gets graded before anyone trusts it.

  1. The problemOpen-ended answers hold the real story and are the slowest part of a survey to code by hand. Teams now hand them to AI with no way of knowing if the labels are right.
  2. What it doesSorts each answer into themes, then compares its labels with labels a person gave the same answers, so you can see where it agrees and where it drifts.
  3. Results281 real answers from the OSMI Mental Health in Tech Survey 2019. First agreement score: kappa 0.28, which is fair. Not good enough to run without a person checking.
  4. ImpactYou find out before a report goes out, not after. The score shows which rules to tighten before the next run.
AgentHuman labelsCohen’s kappaPython
Survey sorter281 answers
Answers sorted into themes281
Checked against human labelsDone
Agreement · kappa0.28 fair
Run without reviewNot yet
Public data: OSMI Mental Health in Tech Survey 2019.

Experience

  1. 2026 — now

    Founder, Interval

    Atlanta, GA

  2. 2023 — now

    Freelance data analyst & data scientist

    Upwork · Top Rated

  3. 2024 — now

    Host, Data According to Me

    Substack newsletter

  4. 2022

    Field epidemiology training

    NFELTP

  5. 2015 — 2022

    Data Analyst / Senior Scientific Officer

    Federal Ministry of Health · Abuja

  6. Education

    B.Sc. (Hons) Physiology

Board story reel for decision making

live

Workbench

live